I just need it so often…
I like graphs (a.k.a. networks), I have studied then among other things in my last MSc.
And it just so happens, that I can use them in several cases, one of which right now I’m thinking about for work.
The idea: SQL to Graph
Well, that’s it, really: I use databases (data lakes…), and end up with tables.
I often then want to visualize that in a graph format. I kinda always repeat the exercise from scratch, which is not ideal.
This time around, strong with my new approach of making R packages of just about anything… I decided why not do that for this (most common, for me) use-case?
And so I did…
DF2GRAPH package
Yes. That’s it, really:
https://github.com/kaizen-R/DF2GRAPH
And yes, to install it, as this is not CRAN, well, you need devtools… But it kinda works though, and this one is very very very simple (it really just wraps everything into one function for the user :D).
So to install, you’ll need:
library(devtools)
install_github("kaizen-R/DF2GRAPH")
You’re done with the installation (that presupposes, though, yes, that you already have devtools, plus compatible R setup… Which might be a lot to suppose, right there :D).
Outcome
It’s quite easy, really:
library(DF2GRAPH)
## Simplest conceptual example:
df <- data.frame(a = c(1,2,3), b = c(1,3,4))
df
g <- df_to_graph(df)
plot(g)
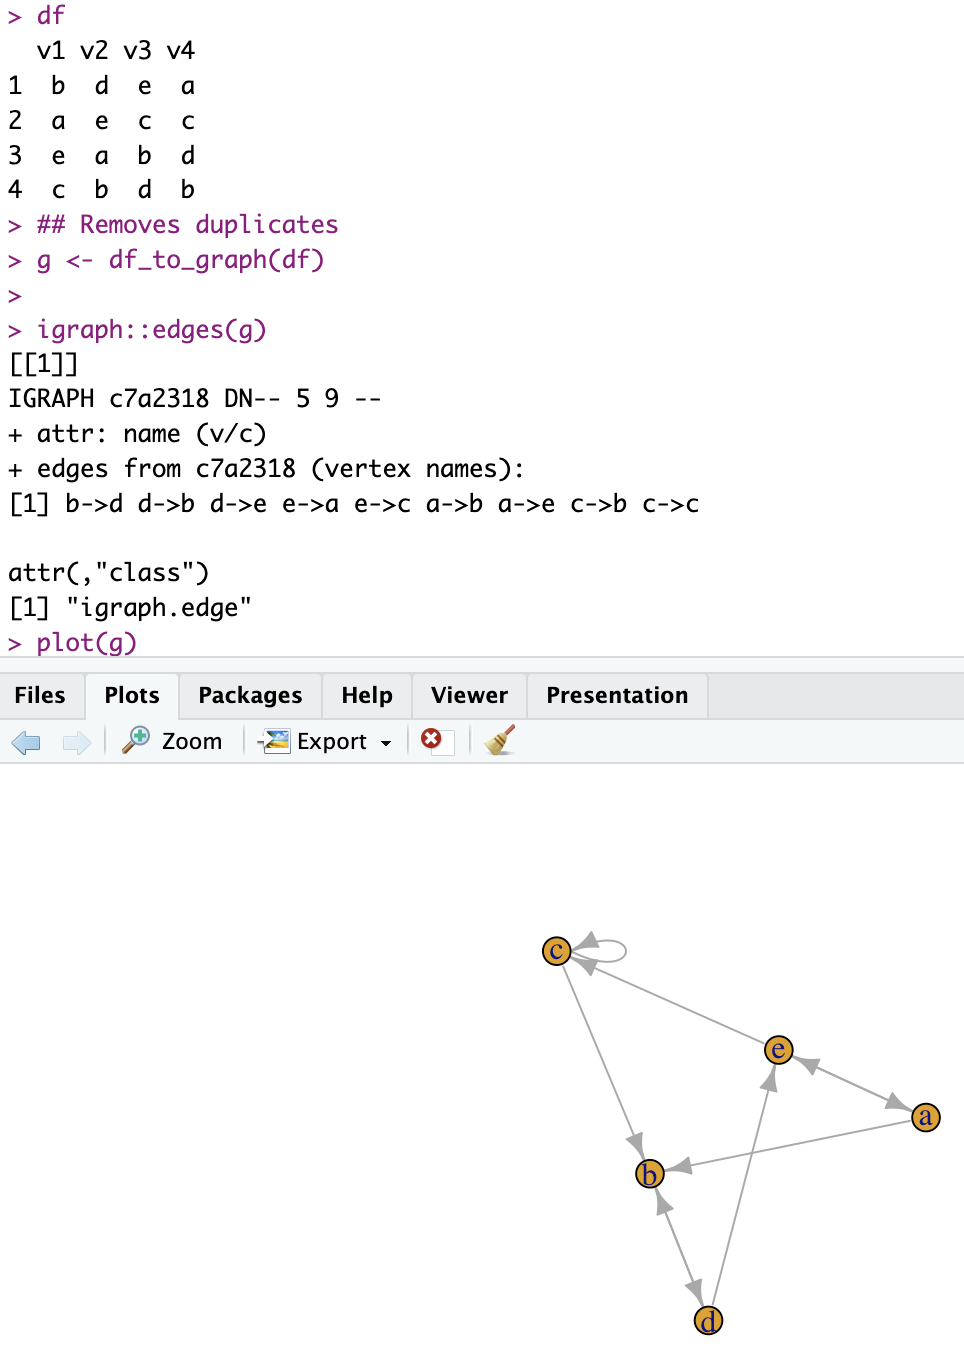
## With more columns:
df <- data.frame(
v1 = sample(letters[1:5], 4),
v2 = sample(letters[1:5], 4),
v3 = sample(letters[1:5], 4),
v4 = sample(letters[1:5], 4)
)
df
## Removes duplicates
g <- df_to_graph(df)
igraph::edges(g)
plot(g)Which output could look like so:
Conclusion
Well, provided I can put together the required SQL queries, I should end up with tables of data that I can then transform into graphs.
My use-case at work, is do the required joins of all possible linking data points from several tables into one (filtered) big table, put that in a graph, and having a start (search keyword) and end (certain cells for which I know they contain interesting info), marking “leafs”, I could then use say Dijkstra to find the best/relevant paths from start to finish, thereby supplementing current search results with more interesting info. (Confusing explained like that, maybe, but nevermind, consider that I have a reason to do this :D).
So now I can go from SQL results into graph in one function call.