I keep at it: Explainable findings
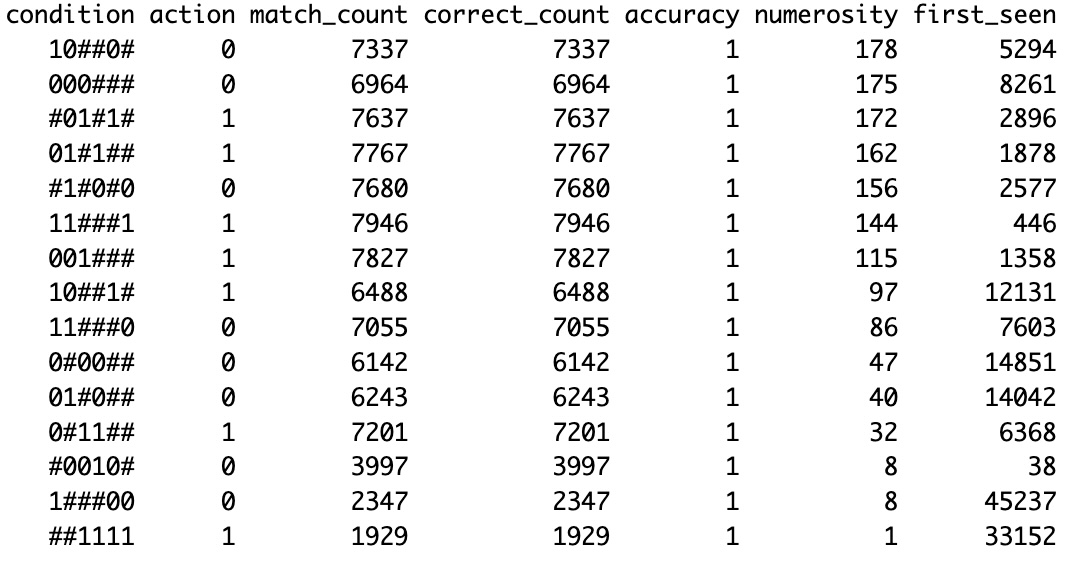
I’ve shown quite a few “Classifiers” and detailed how data mining can be cool with an LCS.
But looking at text-like classifiers populations is not fun (easier for the computer, not fun for the human).
Here is an alternative:
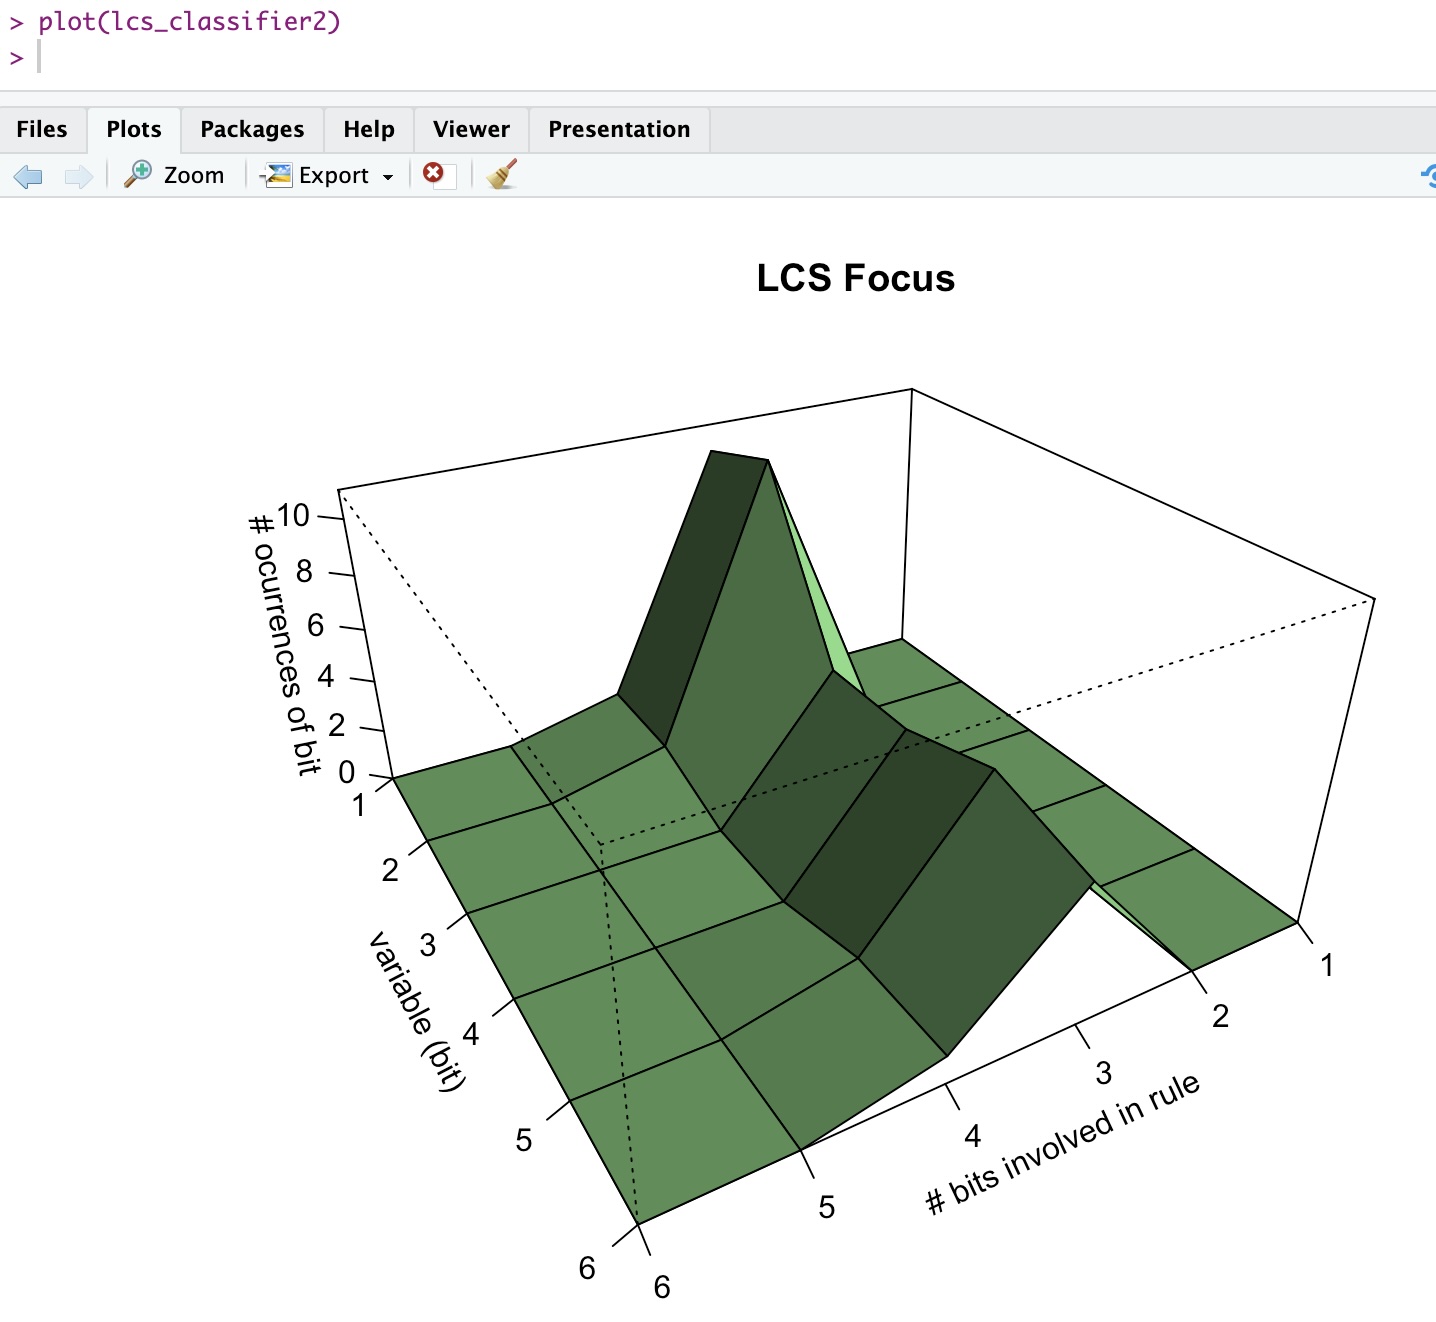
That’s the 3D version of it.
Interpretation: It basically says “most rules will require to know about 3 bits only (out of 6 in this case), and for these, the first two bits are much more important”.
Indeed. That was for the MUX6bits of past examples, the very same proposed in the book about LCS I have referenced in past entries.
I had inspiration from a video by Dr. Will Browne on how one could visualize the attention of an LCS:
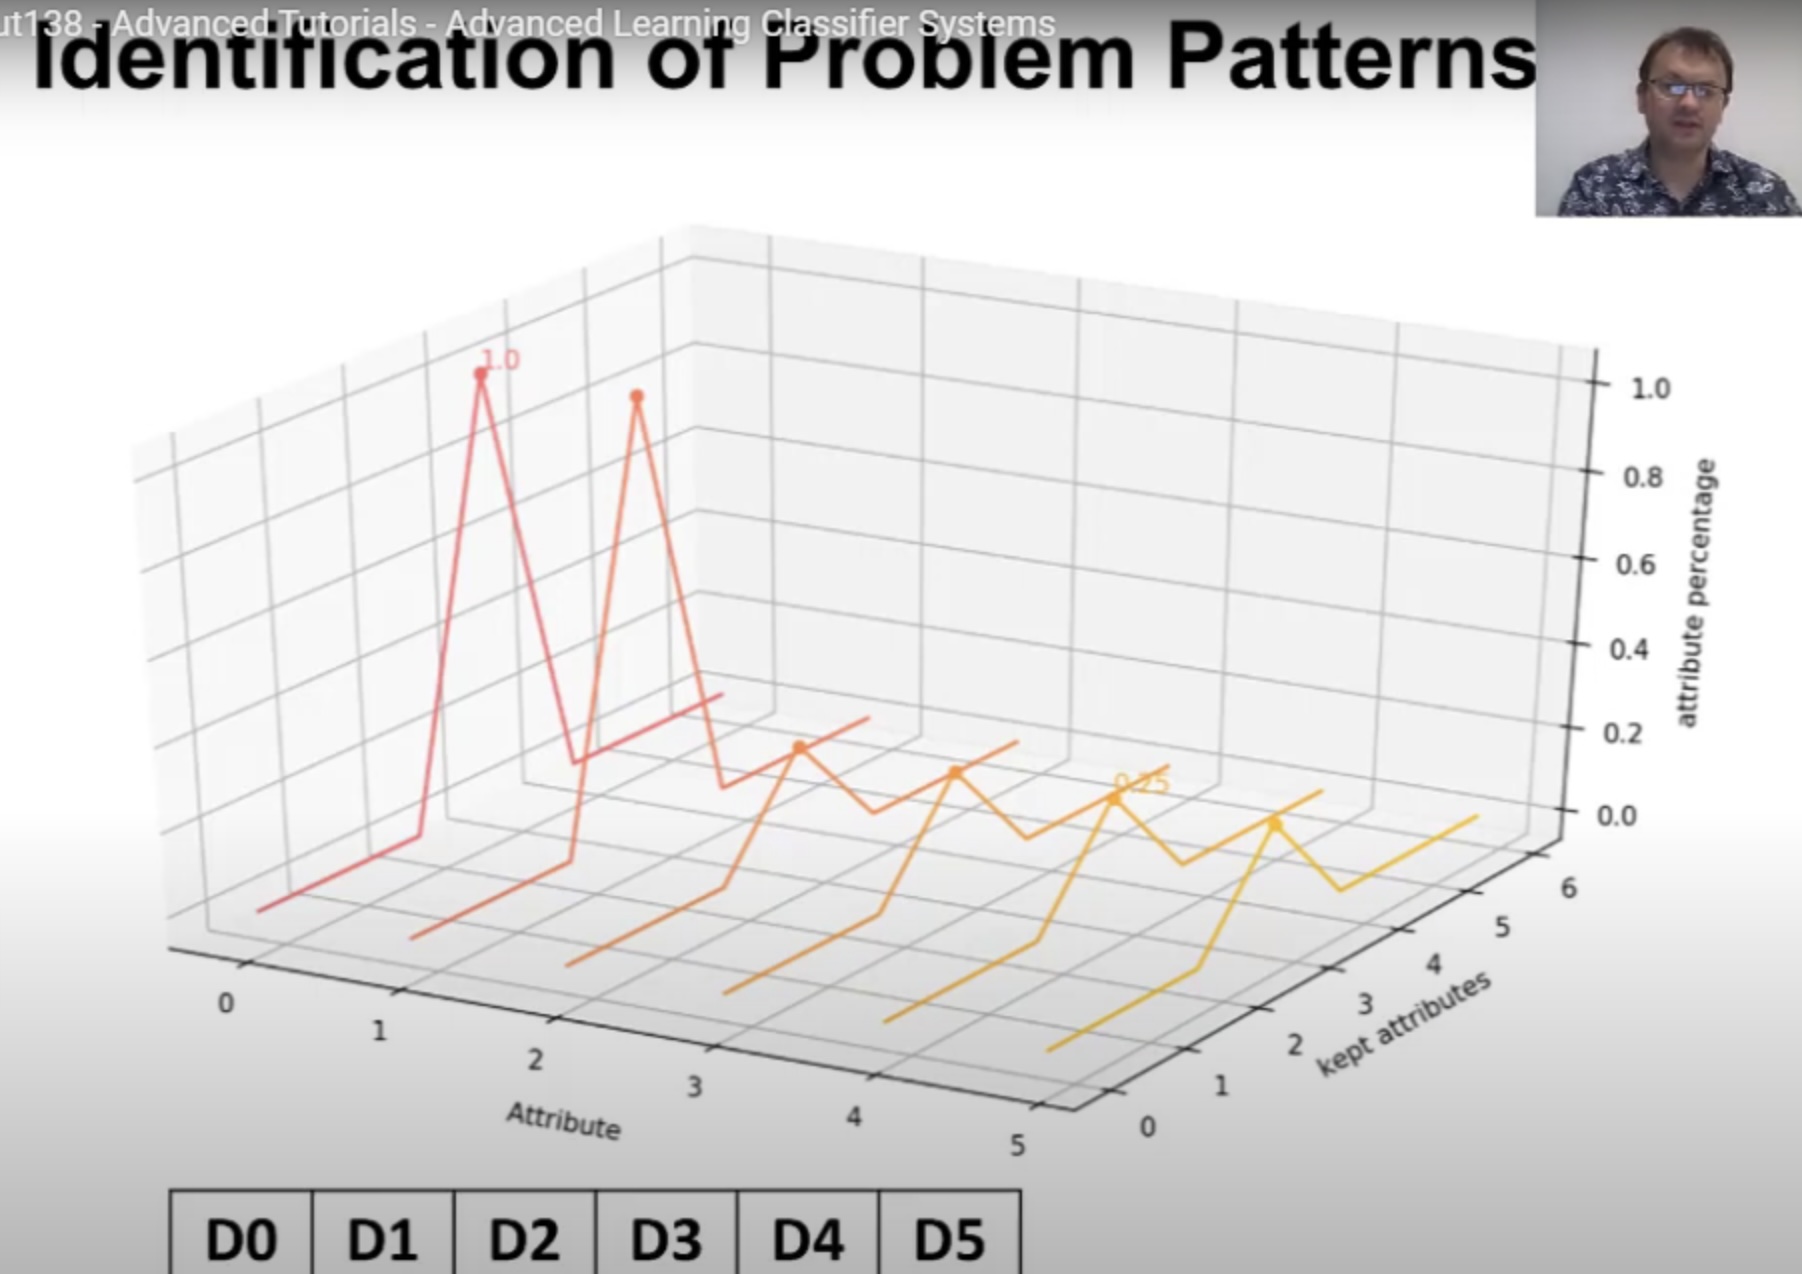
Compared to the past results I have been showing:
I think the visual is better looking :D
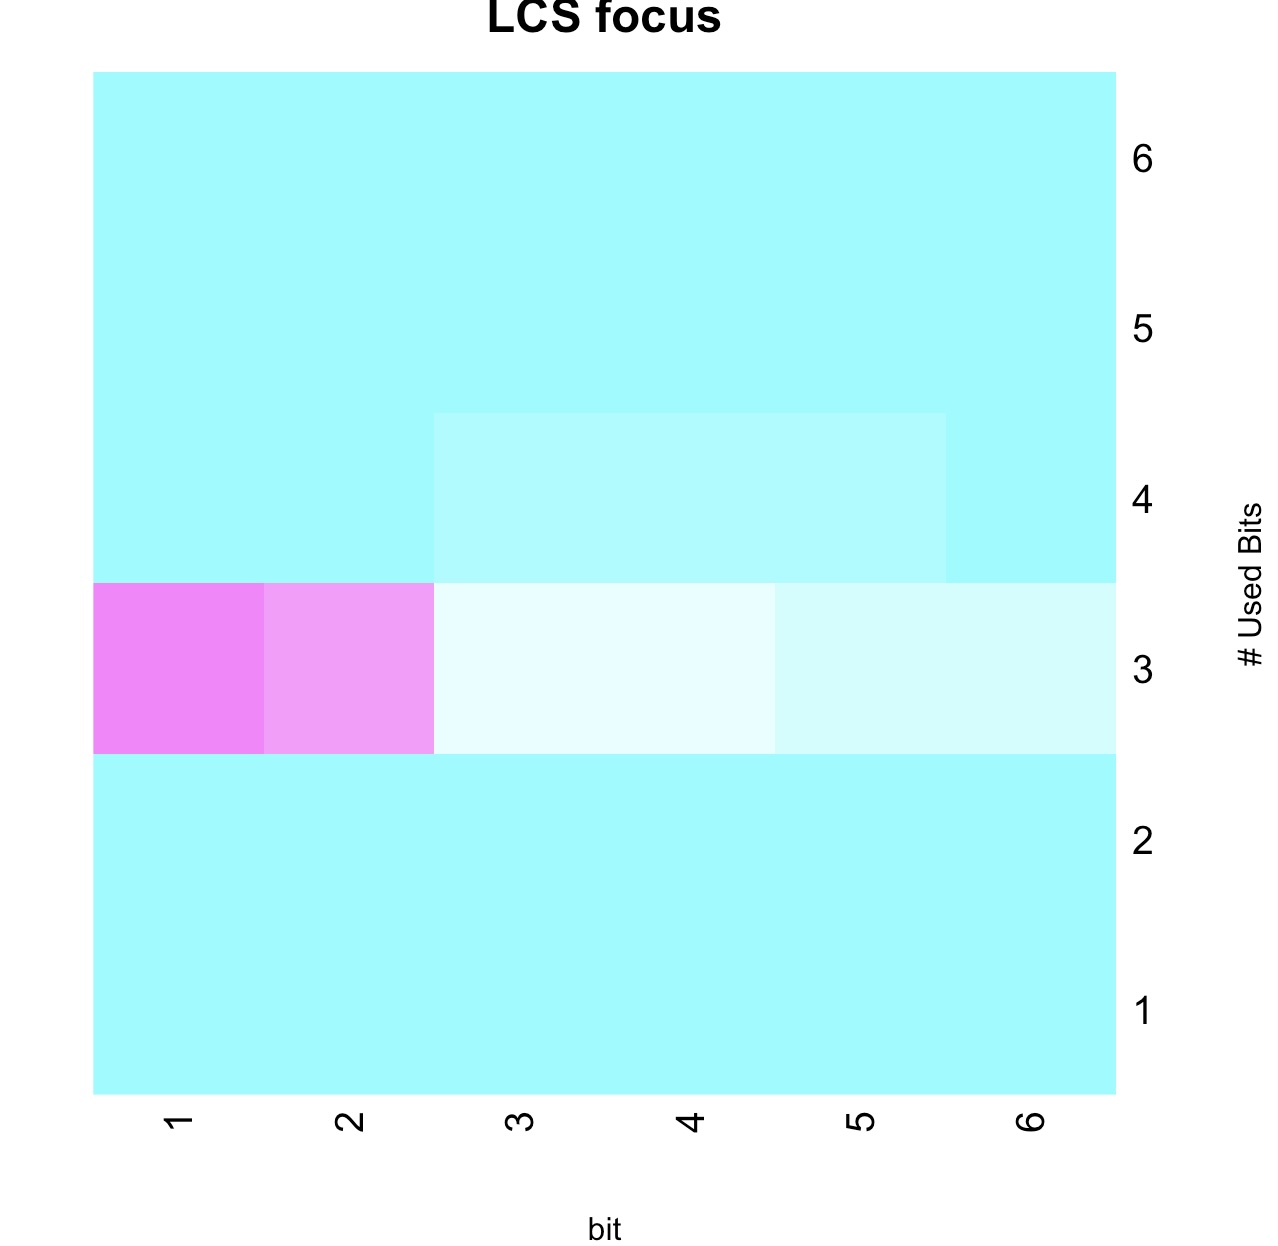
As I am not a fan of forcing 3D on what could be 2D and a palette, here goes an alternative visualization. Less fancy, but just as practical, I think:
Code improvement
Did you notice the code above?
plot(lcs_classifier2)That’s because I am working on doing things a bit better, using in this case S3 objects. I create a class “rlcs_population” and with that I can have dedicated print, plot, etc. functions that are called for these objects!
Still not great, still work ongoing, but… Looking better every day :)
Conclusions
I’m not always a fan of 3D visuals.
But I have to admit, it beats looking at strings of binary numbers in our tertiary alphabet…